【Pond Culture】
Until now, our discussion has been based on laboratory observations. However, observing the fish in real-world rearing environments—especially in mud ponds—is challenging and leaves many uncertainties. To better understand these conditions, we conducted a field survey of mud ponds with the cooperation of a breeder in Niigata. Since this is only our second year of data collection, we still don’t know much, but we will share our findings.
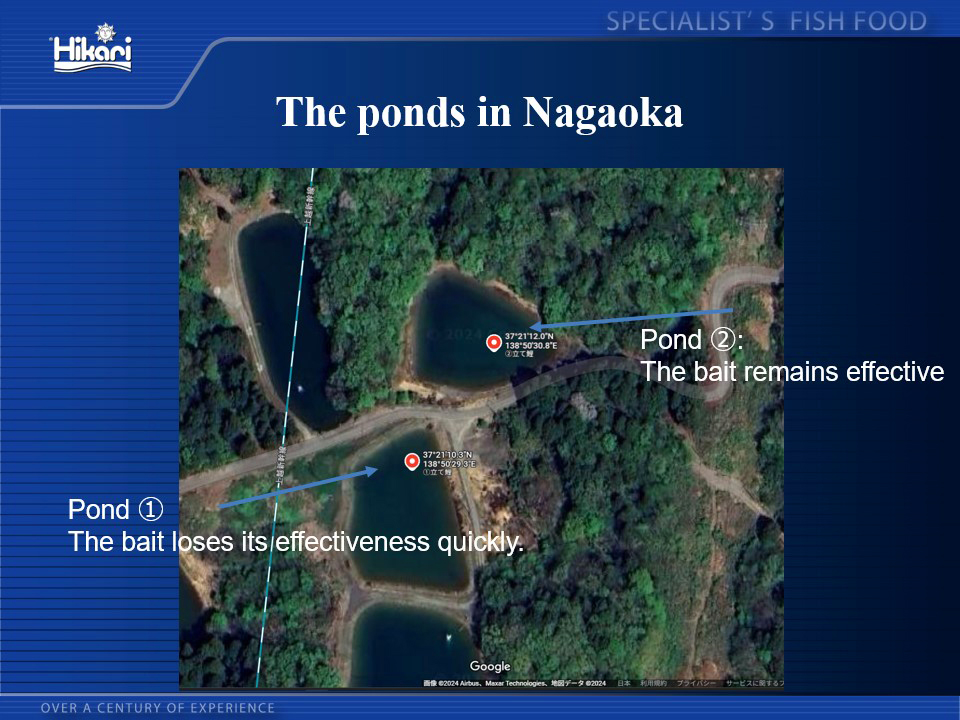
The Nogami Koi Farm generously supported our study and has two neighbouring mud ponds. In Pond 1, feeding activity tends to drop during the summer, while this does not happen in Pond 2 (⑭). Given that the ponds’ size, depth, and environmental conditions are relatively similar, we looked into the possible causes of this difference.
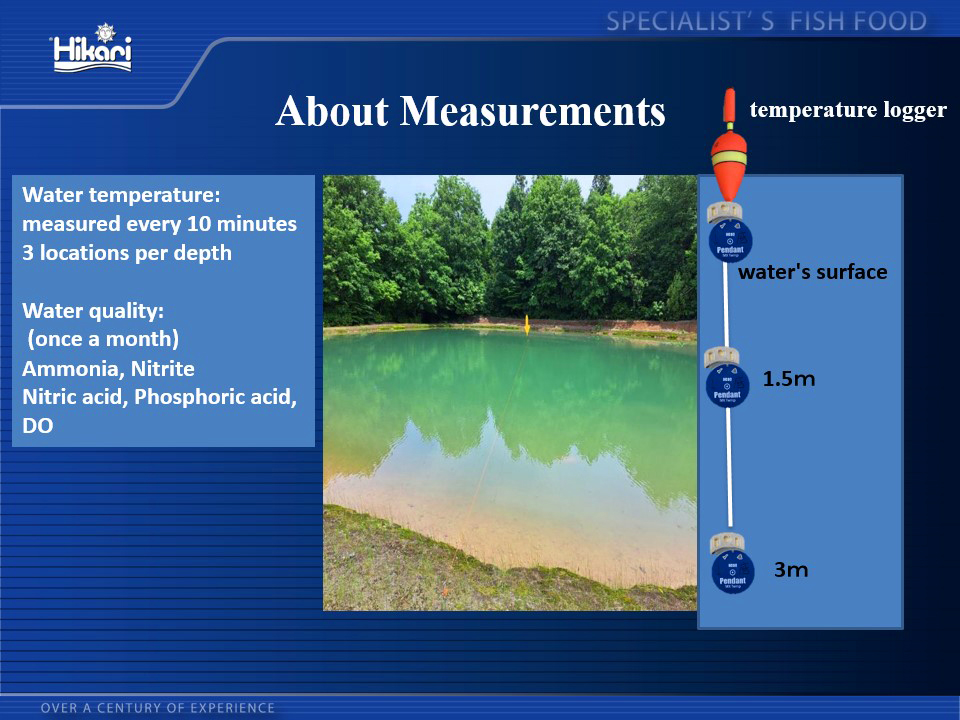
To begin with, we examined the water temperature and quality and conducted regular measurements over about four months, from the end of May to the beginning of October (⑮). To measure the water temperature, we used a temperature logger that recorded the temperature every 10 minutes throughout the entire period. Additionally, to understand how the water temperature changed with depth, we suspended temperature loggers at three locations using fishing floats: just below the surface, at a depth of 1.5 meters, and at a depth of 3 meters. We measured nitrogen compounds, phosphorus, and dissolved oxygen for water quality.
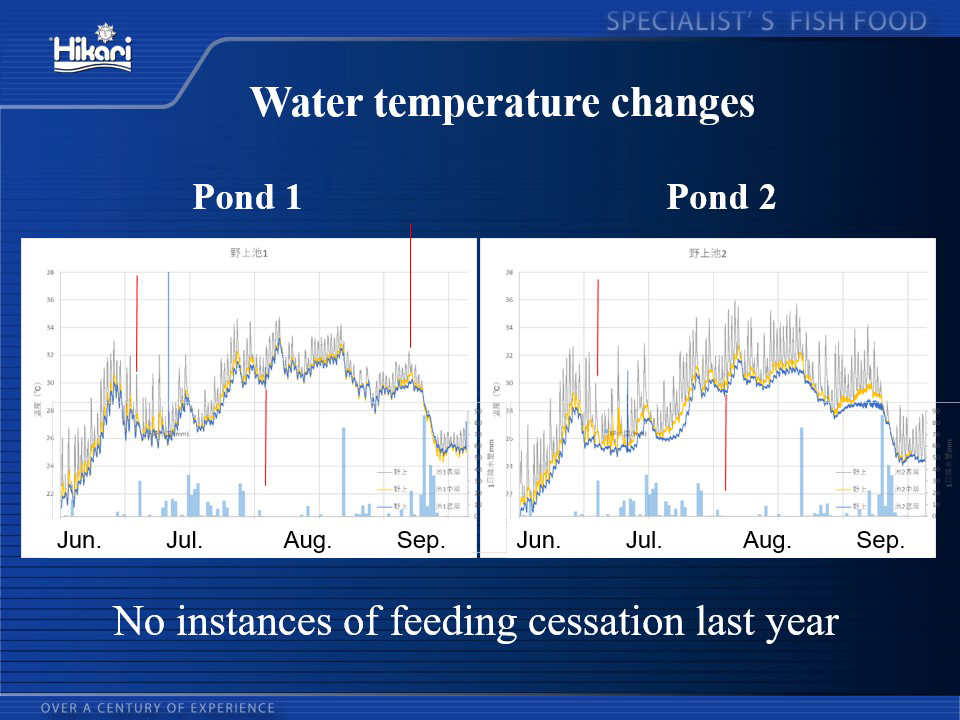
Here are the results for the water temperature (⑯). The graph on the left shows the data for Pond 1, where feeding activity tends to stop, and the graph on the right shows the data for Pond 2. The grey line shows the water temperature just below the surface, the yellow line represents the mid-depth temperature, and the red line indicates the temperature at the bottom layer. The light blue bar graph displays the precipitation. Explaining the data chronologically, feeding activity was good in June, and with little snowfall, there was minimal water from the valley, making rainfall the primary source of water replenishment. The water level dropped by around 10 cm, and the rainy season started on 22nd June. In July, feeding activity remained good, and unlike the previous year, there was significant rainfall, which helped resolve the water shortage. Feeding activity remained good on 1st August, when the rainy season ended, and, unlike the previous year, there were few days with temperatures close to 40°C. Significant rainfall occurred on the 14th, 25th, and 31st of August, with particularly heavy rain on the 25th, which caused a sharp drop in water temperature. On 14th September, feeding activity in Pond 1 nearly stopped, but the rain the following day helped restore it, and the situation improved. While the environment was favourable for the fish last year, unfortunately, feeding activity never stopped as part of the experiment.
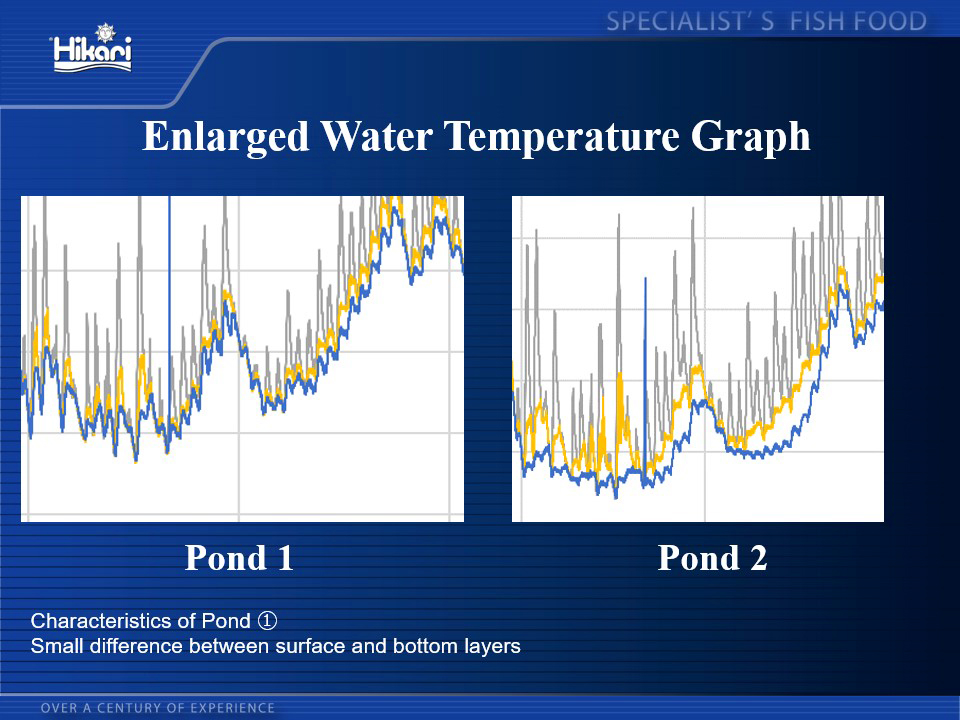
We have enlarged the characteristic part of the graph (⑰). In Pond 1, the three lines overlap significantly, indicating that the temperature difference between the surface and the bottom layer is small, meaning that the koi experience a slight variation in water temperature regardless of their location. Let’s take a look at Pond 2. The grey and yellow lines are far apart from the blue line, indicating that the bottom of the pond is relatively stable, with the water temperature being kept lower.
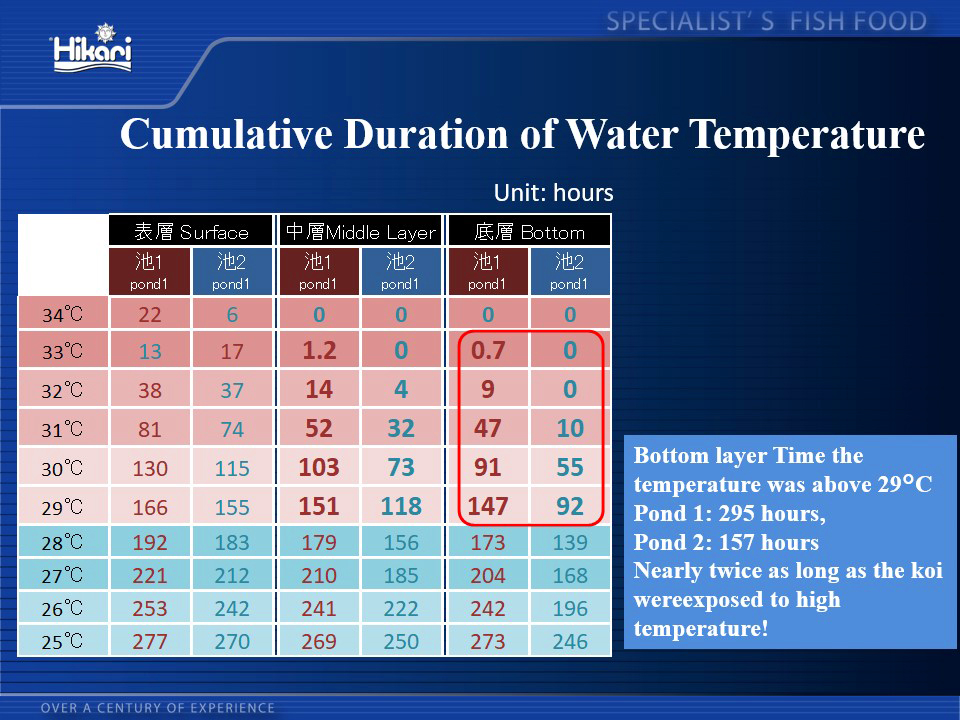
Table ⑱ displays the number of hours each water temperature was recorded at various depths in each pond over the four months of the experiment. For instance, in Pond 1, the surface temperature reached 34°C for 22 hours and 33°C for 13 hours during the four months. This table shows that the surface water temperature is typically higher, with the duration of high temperatures decreasing as the depth increases. While there wasn’t much difference between the surface layers of each pond, variations became more noticeable at the bottom layers. I would like to highlight the area marked in red. It shows that, at the bottom layer, between 29°C and 33°C, Pond 1 had a longer duration of high water temperatures. In Pond 1, the total time spent at temperatures above 29°C was 295 hours, compared to 157 hours in Pond 2. It indicates that the koi in Pond 1 were exposed to temperatures above 29°C for almost twice as long as those in Pond 2.
Koi tend to move to find a more comfortable water temperature during hot periods. However, in Pond 1, even at the bottom, the water temperature is often high, leaving them no place to escape. I believe this may be the reason for the decreased feeding activity.
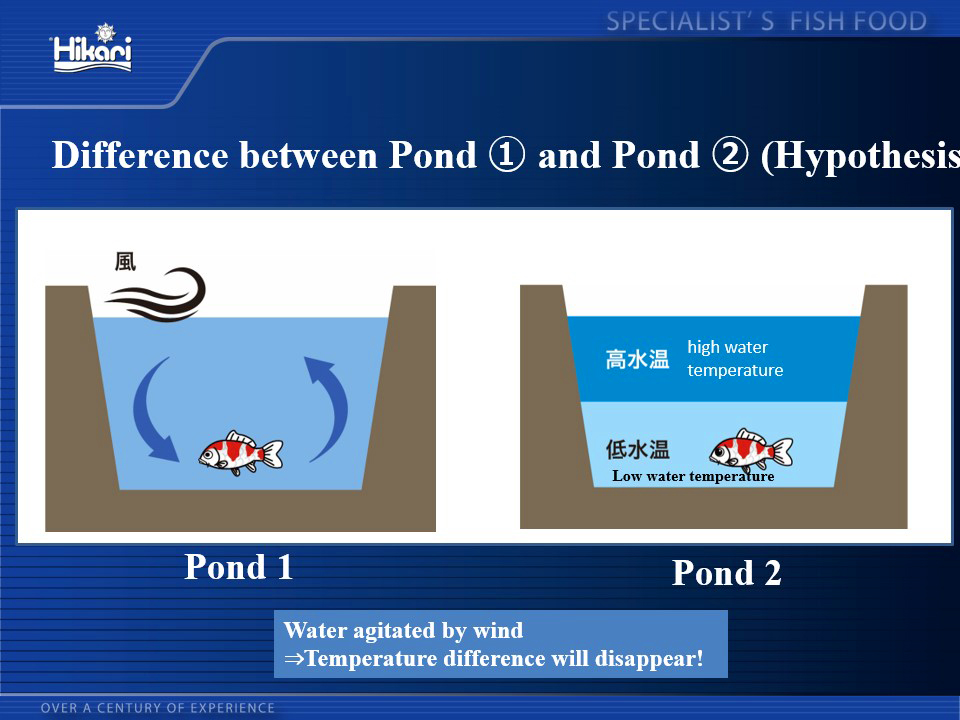
It is commonly known that temperature stratification occurs in ponds and lakes, with high-temperature and low-temperature layers forming separately, as seen in Pond 2. In the case of Pond 2, even though the surface temperature increases, the bottom layer maintains a lower temperature. One possible cause for the disruption of temperature stratification in Pond 1 is the influence of wind (⑲). Strong winds cause the surface water to move, mixing with the bottom layer and resulting in a more uniform water temperature. According to Nogami, Pond 1 is more exposed to the wind, which may be a contributing factor.
We realised that while some breeders install water wheels in mud ponds, this might sometimes have the opposite effect from a water temperature perspective. The water wheel stirs the water, eliminating the cooler bottom layers, which could lead to decreased feeding activity. Of course, water wheels are necessary in ponds where oxygen depletion is a concern, so we can’t make a blanket statement, but we did sense this possibility.
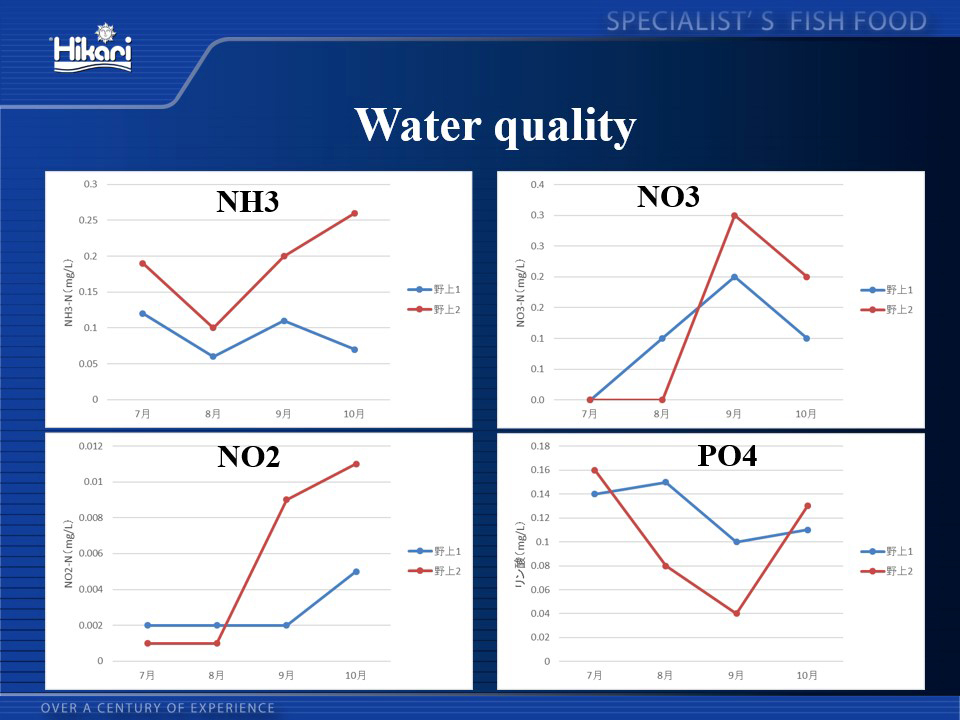
However, there were no significant differences in water quality (⑳). Since feeding activity did not stop last year, we can’t make any definitive conclusions, but we may have found a clue related to the variations in water temperature.
